|
It's been almost a month since my last blog post, and I have yet to write about my results from my regression model for Project Luther. We have just finished up with our third project at Metis (codename McNulty), which had a focus on classification models, d3 visualizations, and Flask API and I am eager to talk about it in my next post, but for now I want to show some of my results from Project Luther. This is a continuation of my previous post, so if you have not read it yet, kindly do so before proceeding with this post. Recap To recap on Project Luther, my goal was to create a regression model to predict the effectiveness of an NBA player in their rookie season measured by their box-plus-minus (BPM). I had left off last post with determining colleges that have historically produced drafted NBA players with a higher rookie year BPM, with the restriction that the college needed to have produced more than 5 NBA players. I then ranked these colleges between 1 to 10 and gave players a ranking corresponding to the college they went to if they attended one of these top ten colleges, and 0 otherwise. More Feature Engineering Another feature I wanted to add to my model was how other players on the rookie's NBA team affect the rookie's BPM. To include this feature in my model, I needed to scrape the advanced stats data for all players in the NBA, for each team, and for each season since 2003, which proved challenging given team names change and franchises move cities. My solution for this problem was to first extract a list for all the URL extensions of each team in my time period (for example, /teams/GSW/2017.html for the 2017 Golden State Warriors). Once a had this list, I looped through my URL list to scrape the data I needed, again using BeautifulSoup. The features I created from this data was the Top 3, Top 5, Top 7 and Top 13 players' BPM for each team and each season, and I merged this data to correspond with the team and season a rookie played in. 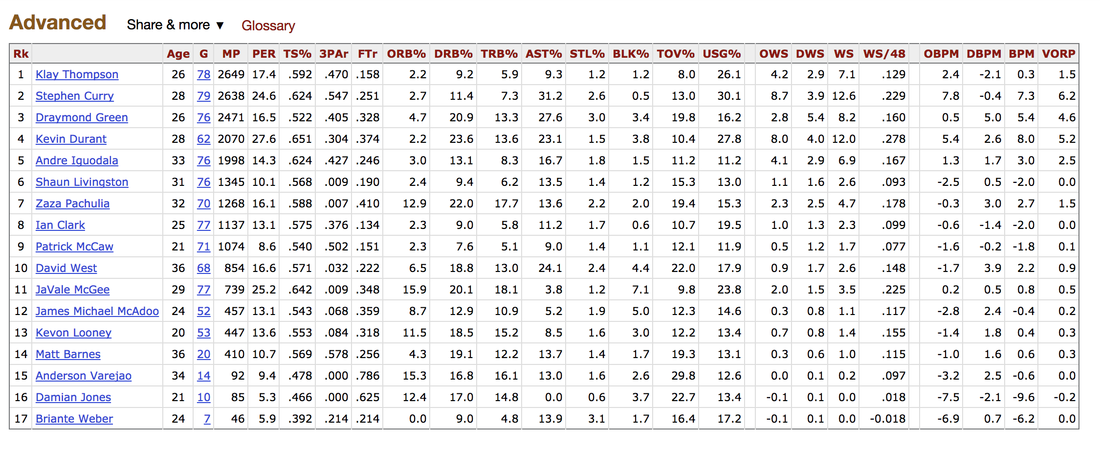 Advanced Stats for 2017 Golden State Warriors Regression Models Now that I have all the data and features I needed, including the college stats I scraped previously, I started training different regression models, using cross-validation methods and tuning parameters using sklearn's GridSearchCV. After trying linear regression models (Lasso and Ridge) and tree based models (random forest and gradient boosting), the best result I got in terms of R-squared was a multiple linear regression model with no regularization with an R-squared of 0.168. 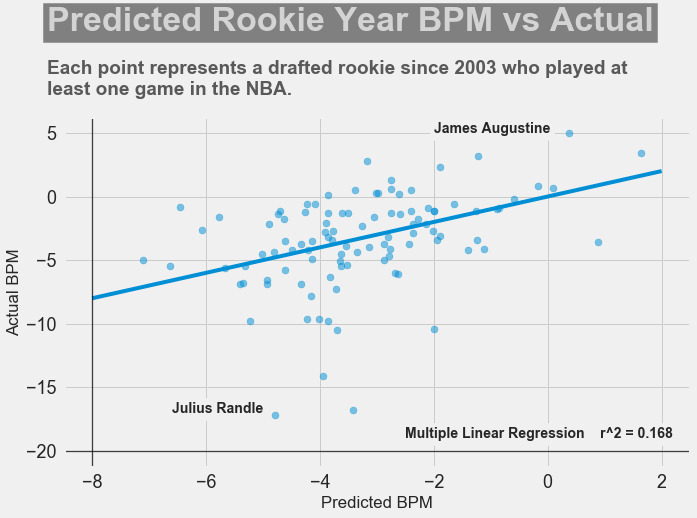 Conclusions I had gone into this project fully understanding that predicting an NBA player's effectiveness in their rookie season was a tough ask, but these results were frankly disappointing. I believe that one of the reasons why the model produced such poor results was the lack of data. Using an 80-20 train-test-split, my holdout set only had about 100 data points. Another reason, in my opinion, why the model did not have much predictive power is that a catch-all per-100-possession statistic like BPM is skewed for players who did not play many possession in their rookie season. Take the graph above, for example. Julius Randle played 14 minutes in 1 game and had a BPM of -16.8 in his rookie season while James Augustine played 7 minutes in 2 games and had a BPM of 5.0 in his rookie season. 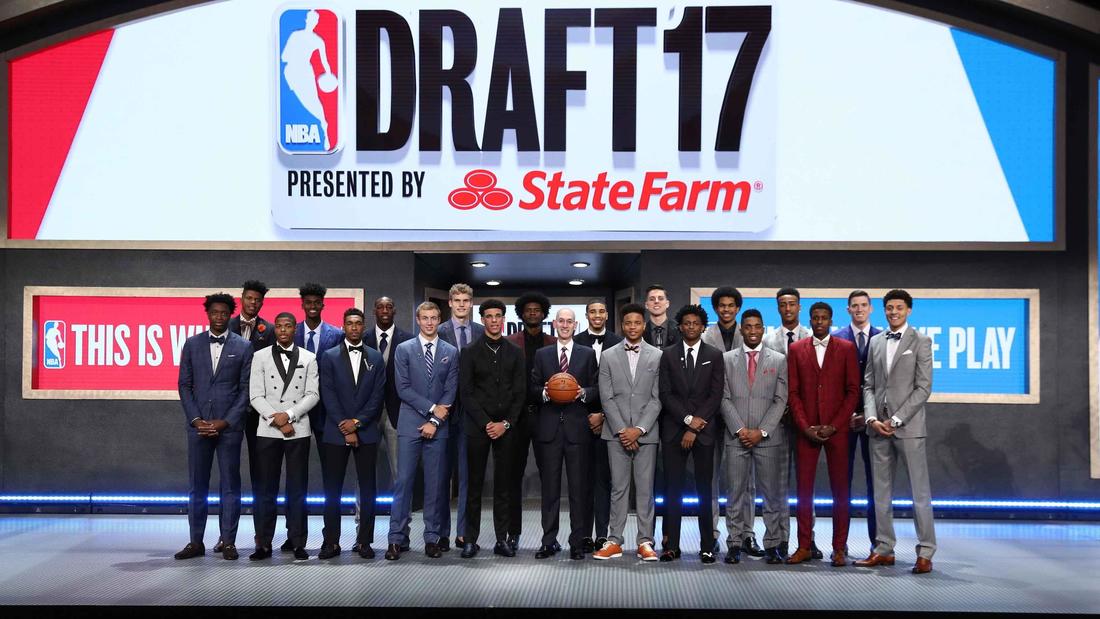 NBA Draft 2017 So how can NBA general managers pick more Blake Griffins (38mpg 22.5ppg 12.1rpg 3.2bpm in his rookie season) and Kevin Durants (34.6mpg 20.3ppg 4.4rpg -1.4bpm in his rookie season), and fewer Kwame Browns and Anthony Bennetts? Well, I suppose if I had a simple answer to that question, I would be getting a lot of NBA teams leaving messages on my phone. Perhaps some other features I could have added to my model were a player's college star rating from recruiters. Another technique I can incorporate into this model is to determine a college player's "hype" from Twitter or basketball forums using natural language processing. Both of these features could perhaps give a better picture of a player's athleticism and potential. These are things I look to add to improve my model, but for the time being, the code for this project can be found on my GitHub.
In my next post, I will be going through my third project, a classification model to predict a cause of a wildfire in the US.
0 Comments
Leave a Reply. |
Kenny LeungPassionate sports fan, wannabe golfer, avid gamer and world traveller. Archives
December 2017
Categories |
 RSS Feed
