|
It's the end of week two, and things have definitely kicked into high gear. I wrote briefly in my last blog post about our project in Week 1 (codename Benson) where we used our newly acquired data munging skills to clean and map NYC MTA subway data into a more manageable form in order to more easily gain insights from the data. This week, we were introduced to our second project, codename Luther. The criterion for this two week project is quite straight-forward: scrape data from the web, and use the data to produce a regression model to predict a dependent variable. For my project, I decided to produce a model to predict the effectiveness of a rookie in their first NBA season based on their college statistics, physical characteristics, among other metrics. In this blog post, I will be talking about a few of the concepts and analysis techniques we learned this week, and how I have applied it to Project Luther.
Web Scraping The majority of the time this week was spent on scraping data from the web using the Python package, BeautifulSoup. The data I am using for Project Luther will be obtained from two sources: Basketball Reference for year-to-year statistics of drafted players in the NBA, and RealGM for college career average statistics in the NCAA since 2003. With only roughly 60 players drafted into the NBA each year, the number of drafted players in the NBA since 2003 is 798 players. However, many of those drafted players did not play in the NCAA (they were either drafted out of high school or from another country), and some of the players did not end up playing a single game in the NBA. After filter out these players, I ended up with a data set of 552 players with 117 features consisting of physical characteristics, average college statistics, average rookie year statistics, and average NBA career statistics. Problem Overview Using a combinations of these features, I plan to predict whether a rookie will contribute to their team in their rookie season. The metric I will be using for this prediction is Box Plus/Minus, or BPM. BPM is a box score-based metric for evaluating basketball players' quality and contribution to the team by taking a player's box score information and the team's overall performance to estimate a player's performance relative to league average. To give an idea of the BPM numbers you would see, 0.0 is league average, +5 means the player is 5 points better than an average player over 100 possessions, -2 is replacement level, and anything lower than -5 is really bad. Basketball Reference has a very detailed page on how BPM was derived by constructing a ridge regression model using a player's advanced statistics (such as True Shooting Percentage (TS%) and Assist Percentage (AST%)) from the 2001-2014 seasons as features and is worth a read through. 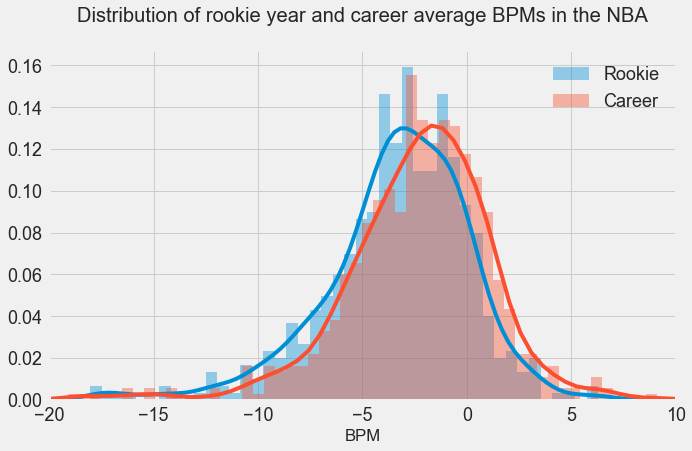
In the above graph, I have plotted the distribution of rookie season and career average BPM's. As we can see, the mean of the rookie year distribution is -3.43, slightly lower than the mean of the career average distribution in -2.52. As stated above, a player should be replaced if their BPM is less than -2 where a "replacement player" is defined as a player on minimum salary or not a normal member of a team's rotation. However, players below replacement level do frequently play, primarily for development purposes. Rookies are frequently below replacement level, but they end up getting playing time in the NBA in order to develop. Lebron James leads the league in terms of career average BPM with 9.1, and the highest single season BPM was put up by Russell Westbrook in the 2016-2017 season with 15.6.
Feature Engineering Simply plugging in college statistics into a regression model in hopes of finding some meaningful correlation for BPM may not be the best strategy, as there are many factors which may contribute to whether a rookie will perform well in their first NBA season. Historically, there have been certain colleges that produce high-level NBA players, and a player having played for that college may be an indicator of whether they make good NBA players. My method for taking this into account is to first determine the colleges that produce a higher number of NBA draft picks as well as producing rookies with higher BPM's in their first year. The below shows the 10 colleges and the average BPM of its draft picks in their rookie year for colleges that produced more than 5 draft picks since 2003.
Another factor for how well a rookie performs is which team they get drafted by. A rookie who is drafted into a team with a lower average BPM (ie. a not so good team) may perform better than a rookie who is drafted into a team with a higher average BPM, simply because they may have more opportunities to play. On the other hand, a player drafted into a better team may perform better since they are playing with better players. Perhaps there is no relationship between the two, but I would need to analyze the results before I can make a definitive conclusion. My focus for next week will be to prepare my dataset by scaling the features and making dummy variables. Taking all I have discussed above into account, I will create multiple regression models, use cross-validation methods, and also try random forests algorithms to see which model performs the best. Stay tuned.
0 Comments
Hi. Welcome to my blog. In this first post, I am going to be talking a little bit about myself, why I chose to attend the 12-week immersive data science boot camp at Metis, my thoughts on the first week of the bootcamp and some of the challenges I have faced along the way. So, to start things off, some introductions. I'm Kenny. I was lucky enough to grow up in one of the most beautiful cities in the world, Vancouver. I studied Mechanical Engineering at one of the local universities, and since graduating, I have worked as a material handling engineer at an engineering consulting company in the mining and metals industry, and as a loss prevention consultant for a global insurance company. I recently came back from a year-long working-holiday in Australia, where I got to wake up to this every morning:  Bondi Beach, Sydney, AU That's Bondi Beach in Sydney, and my apartment was the turquoise building in the background. My time in Sydney pretty much consisted of drinking top-notch coffee, lazing on the beach, swimming in the ocean, and working on an awesome tan. It was pretty sweet. After living in Sydney for 9-months, which included quick stops in New Zealand and Fiji, I began my four-month long travels throughout the rest of Australia, into Southeast Asia, and finally to Taiwan and Hong Kong. Some of the highlights of the trip were snorkelling in the Ningaloo Reef, watching the sun rise over Uluru, exploring Angkor Wat, cruising Ha Long Bay, admiring the reflection of Inle Lake in Myanmar, and the extraordinary food in Panang, Malaysia. My year abroad allowed me to reflect on what I wanted to do career-wise moving forward, and particularly on what I didn't want to do, which was continue with engineering. I started to learn more about data science and machine learning and was amazed by all its capabilities, and excited about its untapped potential. I began researching paths I could take to pursue a career in this fascinating field. Through my research, I discovered Metis, a full-time, 12-week data science program where I could learn data science theory and techniques, as well as build a portfolio of projects to present to future employers. For me, the prospect of learning practical skills and having the opportunity to meet like-minded individuals was intriguing. In March of 2017, while I was still travelling Australia, I had an extremely informative phone conversation with the Director of Admissions at Metis, Amy Ramnath, who explained to me the entire application process and what I could expect to gain from the bootcamp. She also provided me with important resources aimed to build on my technical and statistical background. After that phone conversation, I was convinced that the people at Metis would do everything in their power to help their students succeed. I began brushing up on my calculus and linear algebra, took an online course on probability and statistics offered by Harvard, and learned how to use Python for data analysis/visualization and machine learning. When I arrived home in Vancouver in June of 2017, I started the application process with Metis in the hopes of attending the fall cohort in Seattle starting in September. The entire application process took around three weeks, and consisted of a technical assessment, a take-home coding challenge, an API challenge along with some exploratory data analysis using Python, and finally a Skype interview with a Senior Data Scientist at Metis. After being accepted into Metis, they provided me with additional pre-work to be completed prior to the start of the bootcamp, which involved a 60-hr online curriculum designed to ensure that students have the foundation skills to hit the ground running on day one. The first road block of this journey came three days before the start of the bootcamp, when I learned that due to an administrative error, I was unable to attend the bootcamp in Seattle. I was instead offered the opportunity to attend the cohort in New York or San Francisco. Luckily for me, I had family living near San Francisco and was able to make some last minute arrangements and fly to the Bay Area. Although the hiccup caused me to miss the first two days of the bootcamp, I was fortunate to have incredible project partners, who quickly brought me up to speed on the project and presentation due at the end of the week. The project had us exploring New York's Metropolitan Transportation Authority's turnstile data and to think of ways to extract insight from the data to benefit a business. It was a pleasure meeting the instructors, TAs, and the rest of the cohort. I was relieved when I found out how positive and bright my fellow students were, and I am eager to see what the next 11 weeks has in store for us.  San Francisco, CA |
Kenny LeungPassionate sports fan, wannabe golfer, avid gamer and world traveller. Archives
December 2017
Categories |


 RSS Feed
