|
It's the end of week two, and things have definitely kicked into high gear. I wrote briefly in my last blog post about our project in Week 1 (codename Benson) where we used our newly acquired data munging skills to clean and map NYC MTA subway data into a more manageable form in order to more easily gain insights from the data. This week, we were introduced to our second project, codename Luther. The criterion for this two week project is quite straight-forward: scrape data from the web, and use the data to produce a regression model to predict a dependent variable. For my project, I decided to produce a model to predict the effectiveness of a rookie in their first NBA season based on their college statistics, physical characteristics, among other metrics. In this blog post, I will be talking about a few of the concepts and analysis techniques we learned this week, and how I have applied it to Project Luther.
Web Scraping The majority of the time this week was spent on scraping data from the web using the Python package, BeautifulSoup. The data I am using for Project Luther will be obtained from two sources: Basketball Reference for year-to-year statistics of drafted players in the NBA, and RealGM for college career average statistics in the NCAA since 2003. With only roughly 60 players drafted into the NBA each year, the number of drafted players in the NBA since 2003 is 798 players. However, many of those drafted players did not play in the NCAA (they were either drafted out of high school or from another country), and some of the players did not end up playing a single game in the NBA. After filter out these players, I ended up with a data set of 552 players with 117 features consisting of physical characteristics, average college statistics, average rookie year statistics, and average NBA career statistics. Problem Overview Using a combinations of these features, I plan to predict whether a rookie will contribute to their team in their rookie season. The metric I will be using for this prediction is Box Plus/Minus, or BPM. BPM is a box score-based metric for evaluating basketball players' quality and contribution to the team by taking a player's box score information and the team's overall performance to estimate a player's performance relative to league average. To give an idea of the BPM numbers you would see, 0.0 is league average, +5 means the player is 5 points better than an average player over 100 possessions, -2 is replacement level, and anything lower than -5 is really bad. Basketball Reference has a very detailed page on how BPM was derived by constructing a ridge regression model using a player's advanced statistics (such as True Shooting Percentage (TS%) and Assist Percentage (AST%)) from the 2001-2014 seasons as features and is worth a read through. 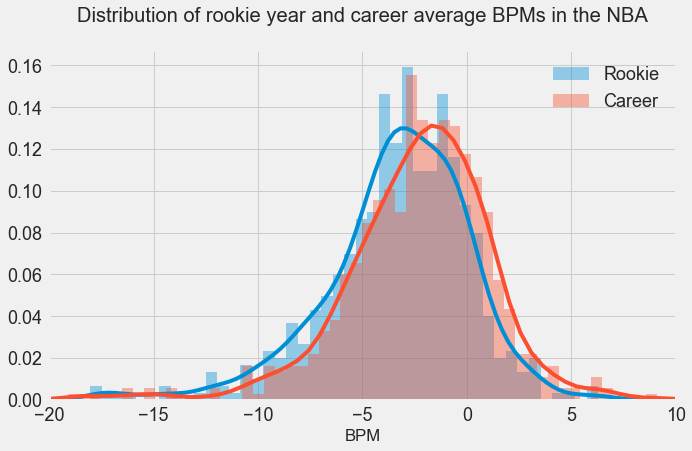
In the above graph, I have plotted the distribution of rookie season and career average BPM's. As we can see, the mean of the rookie year distribution is -3.43, slightly lower than the mean of the career average distribution in -2.52. As stated above, a player should be replaced if their BPM is less than -2 where a "replacement player" is defined as a player on minimum salary or not a normal member of a team's rotation. However, players below replacement level do frequently play, primarily for development purposes. Rookies are frequently below replacement level, but they end up getting playing time in the NBA in order to develop. Lebron James leads the league in terms of career average BPM with 9.1, and the highest single season BPM was put up by Russell Westbrook in the 2016-2017 season with 15.6.
Feature Engineering Simply plugging in college statistics into a regression model in hopes of finding some meaningful correlation for BPM may not be the best strategy, as there are many factors which may contribute to whether a rookie will perform well in their first NBA season. Historically, there have been certain colleges that produce high-level NBA players, and a player having played for that college may be an indicator of whether they make good NBA players. My method for taking this into account is to first determine the colleges that produce a higher number of NBA draft picks as well as producing rookies with higher BPM's in their first year. The below shows the 10 colleges and the average BPM of its draft picks in their rookie year for colleges that produced more than 5 draft picks since 2003.
Another factor for how well a rookie performs is which team they get drafted by. A rookie who is drafted into a team with a lower average BPM (ie. a not so good team) may perform better than a rookie who is drafted into a team with a higher average BPM, simply because they may have more opportunities to play. On the other hand, a player drafted into a better team may perform better since they are playing with better players. Perhaps there is no relationship between the two, but I would need to analyze the results before I can make a definitive conclusion. My focus for next week will be to prepare my dataset by scaling the features and making dummy variables. Taking all I have discussed above into account, I will create multiple regression models, use cross-validation methods, and also try random forests algorithms to see which model performs the best. Stay tuned.
0 Comments
Leave a Reply. |
Kenny LeungPassionate sports fan, wannabe golfer, avid gamer and world traveller. Archives
December 2017
Categories |
 RSS Feed
